
The Social Value Need Index
What the Index is
The Social Value Need Index is a free and open-source tool developed by WPI Strategy on behalf of the Social Value Commission with the insights of Combined Authorities and private sector practitioners.
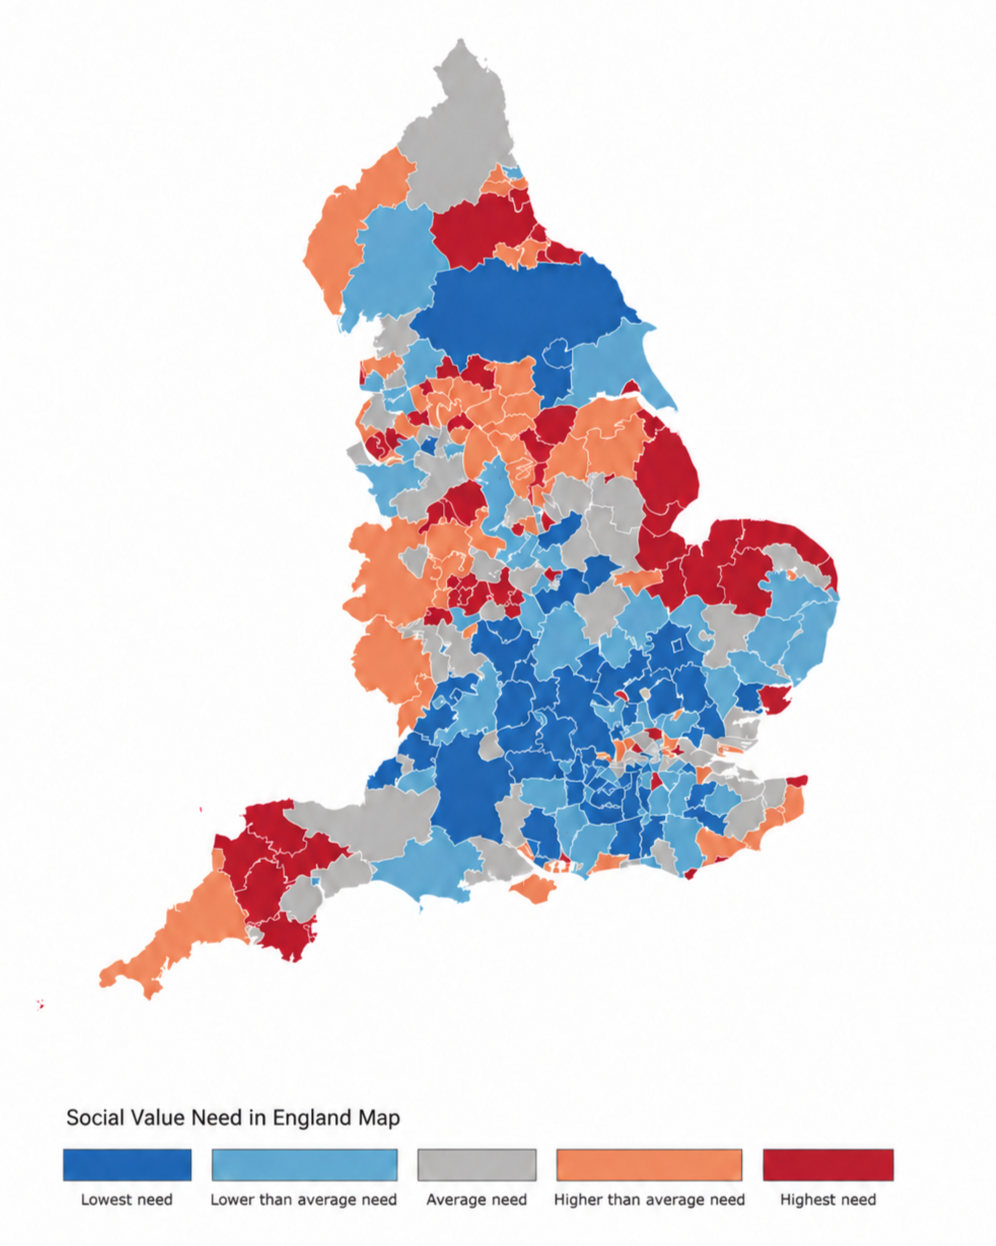
The tool allows users to select one or more local authorities, combined authorities or regions to understand the social value need of an area across ten investment pillars, including Education and skills, Health, Housing, and more.
The Social Value Need Index score for each area is calculated across ten equally weighted pillars. Together, these pillars draw on 90 published administrative data metrics, covering all 296 local authorities in England.
The ten pillars:
| Pillar | What it covers |
|---|---|
| Education and skills | Educational outcomes and qualifications |
| Employment and business growth | Employment conditions and business activity |
| Health | Health outcomes and wider health conditions |
| Housing | Affordability, housing conditions and demand |
| Environment | Environmental conditions and access to green space |
| Energy sources | Household energy conditions and renewable energy provision |
| Digital connectivity | Broadband and mobile connectivity |
| Transport | Access to services and transport connections |
| Sport and leisure | Facilities, participation and provision |
| Culture | Cultural assets, provision and spending |
Watch the instruction videoHide the instruction video
How to use the index
To utilise the Index, begin on the Overview tab with a relevant geography: Local Authority, Combined Authority, or Region. This tab provides a quick summary of performance, while highlighting the lowest and highest need pillars for each geography. Selecting multiple geographies allows for specific pillar comparisons between different areas. The Top 10/Bottom 10, Full Ranking, and Map tabs, help situate given areas among their counterparts.
To answer a specific question, the Pillar Overview tab provides the data that underlies the pillar scores and by extension the composites, complete with brief summaries and standardised comparisons of each of the metrics that make up a pillar against England averages. This allows users to examine what drives the pillar scores.
The Index’s Build your Own Index tab offers the flexibility to assess different definitions of social value. Users can select the metrics that match a programme, set their weights, and save their settings to return to their definition online.
Finally, the remaining tabs offer additional context without being incorporated into the Index calculus. A ward-level view extends the approach below local-authority geography for six of the ten pillars and polling data is stored in the Public Opinion tab, which puts the results of polling conducted by the Social Value Commission against the Index in terms of percentiles.
Social Value Need scoring methodology
Each metric is z-score standardised so that the England local-authority average is zero. A metric score of 1 indicates that an area is 1 standard deviation above the England average.
Because pillar and overall scores are averages of these metric scores and are not re-standardised, they are less spread out, so a standard deviation in the overall score is about 0.2.
A higher score means stronger measured performance and lower social value need. Metric scores are averaged into pillar scores, and the ten pillars carry equal weight in the overall score. Combined authority and regional views are population-weighted averages of their constituent authorities.